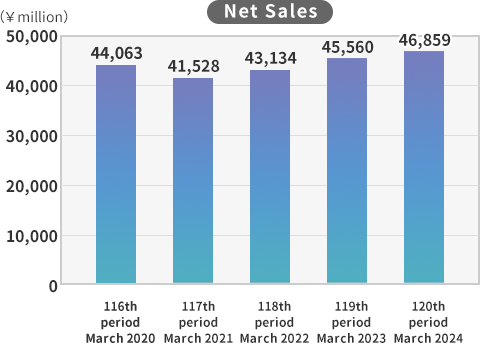
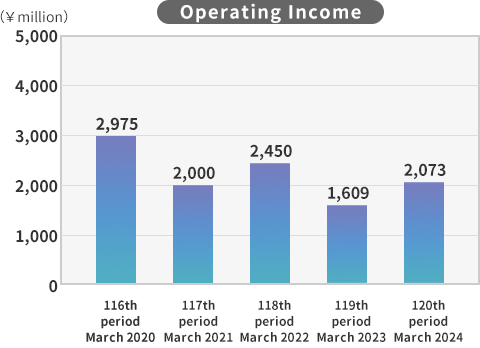
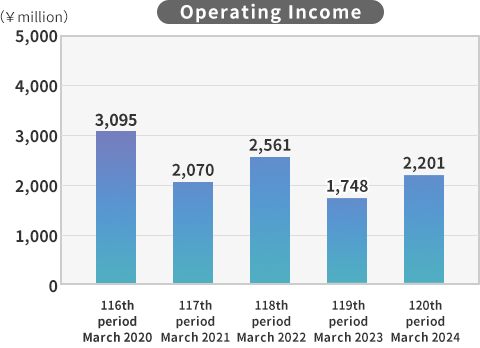
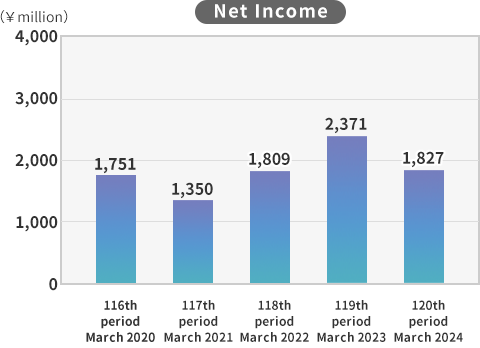
Consolidated Operating Results
| 118th period | 119th period | 120th period | 121th period | 122th period | |
|---|---|---|---|---|---|
| Month of Settlement | March 2022 | March 2023 | March 2024 | March 2025 | March 2026 |
| Net Sales | 43,134 | 45,560 | 46,859 | 49,457 | 50,470 |
| Operating Income | 2,450 | 1,609 | 2,073 | 2,586 | 2,270 |
| Ordinary Income | 2,561 | 1,748 | 2,201 | 2,681 | 2,442 |
| Net Income | 1,809 | 2,371 | 1,827 | 1,959 | 1,652 |
- *
Sales figures do not include consumption taxes.
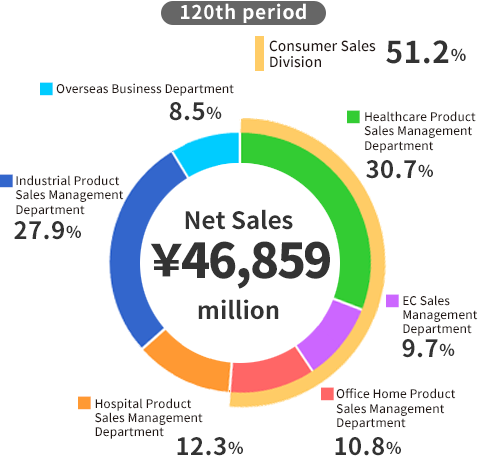
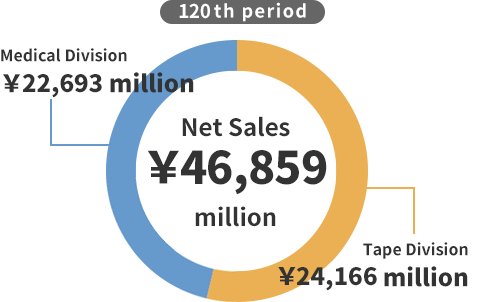
Sales by Business Category
| 121th period | 122th period | |
|---|---|---|
| Month of Settlement | March 2025 | March 2026 |
| Medical Division | 24,584 | 24,936 |
| Tape Division | 24,873 | 25,534 |
| Total | 49,457 | 50,470 |
| Business Category | |||||
|---|---|---|---|---|---|
| Medical Business | Tape Business | Total | |||
| Sales | |||||
| Domestic | Consumer Sales Division |
Healthcare (OTC) | 15,308 | - | 15,308 |
| Electric- Commerce (EC) |
1,155 | 4,203 | 5,359 | ||
| Stationery | - | 4,842 | 4,842 | ||
| Total | 16,464 | 9,046 | 25,510 | ||
| Hospital | 5,675 | - | 5,675 | ||
| Industrial | - | 13,864 | 13,864 | ||
| Total | 22,140 | 22,910 | 45,050 | ||
| Overseas | Global | 2,796 | 2,623 | 5,420 | |