Consolidated Balance Sheet
Assets(¥ million)
|
120th period |
121th period |
| Month of Settlement |
March 2024 |
March 2025 |
| Current Assets |
38,639 |
39,756 |
| Fixed Assets |
29,400 |
27,846 |
| Breakdown |
Tangible fixed Assets |
22,838 |
20,943 |
| Intangible fixed assets |
985 |
648 |
| Investment and other assets |
5,576 |
6,254 |
| Total Assets |
68,039 |
67,603 |
Liabilities(¥ million)
|
120th period |
121th period |
| Month of settlement |
March 2024 |
March 2025 |
| Current liabilities |
16,880 |
17,040 |
| Fixed Liabilities |
9,455 |
7,375 |
| Total liabilities |
26,336 |
24,415 |
Net Assets(¥ million)
|
120th period |
121th period |
| Settlement Date |
March 2024 |
March 2025 |
| Stockholders' Equity |
40,219 |
41,477 |
| Breakdown |
Capital |
5,451 |
5,451 |
| Capital Surplus |
4,186 |
4,188 |
| Retained Earnings |
31,233 |
32,480 |
| Treasury Stock |
△652 |
△642 |
| Accumulated Other Comprehensive Income |
1,484 |
1,709 |
| Breakdown |
Valuation Difference on Other Securities |
362 |
395 |
| Foreign Currency Translation Adjustment Account |
81 |
203 |
| Accumulated Adjustment for Retirement Benefits |
1,040 |
1,111 |
| Total Net Assets |
41,703 |
43,187 |
| Total Liabilities and Net Assets |
68,039 |
67,603 |
Consolidated Statement of Income
(¥ million)
|
120th period |
121th period |
| Month of settlement |
March 2024 |
March 2025 |
| Net sales |
46,859 |
49,457 |
| Cost of sales |
32,988 |
34,555 |
| Gross profit |
13,871 |
14,902 |
| Selling, general and administrative expenses |
11,798 |
12,315 |
| Other income |
303 |
339 |
| Other expenses |
175 |
244 |
| Ordinary income |
2,201 |
2,681 |
| Extraordinary income |
71 |
- |
| Extraordinary loss |
- |
53 |
| Income before income taxes |
2,273 |
2,628 |
| Corporate tax, etc |
445 |
668 |
| Net income |
1,827 |
1,959 |
| Net income attributable to non-controlling shareholders |
- |
- |
| Net income attributable to owners of parent |
1,827 |
1,959 |
Consolidated Cash Flow
(¥ million)
|
120th period |
121th period |
| Month of settlement |
March 2024 |
March 2025 |
| Cash flows from operating activities |
3,187 |
3,690 |
| Cash flows from investing activities |
△3,692 |
△1,695 |
| Cash flows from financing activities |
△1,225 |
△763 |
| Exchange differences on cash and cash equivalents |
27 |
25 |
| Change in cash and cash equivalents |
△1,702 |
1,257 |
| Cash and cash equivalents at beginning of year |
14,752 |
13,049 |
| Cash and cash equivalents at end of year |
13,049 |
14,307 |
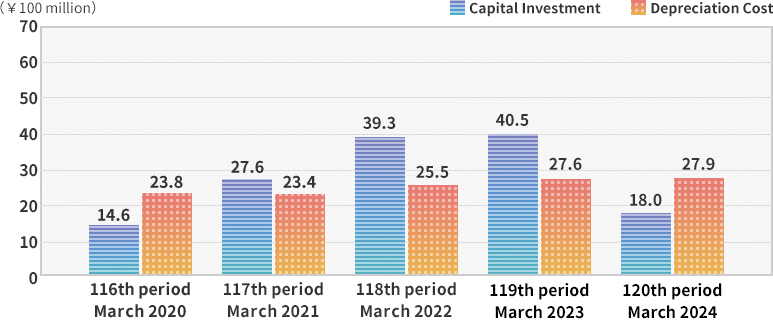
Capital Investment and Depreciation
Financial and Performance Information