Environment Management System
Acquisition of ISO14001 Certification
The Nichiban Group has acquired ISO14001 certification and is constantly working to improve environmental management systems. Through internal audits conducted by the company and audits conducted by external auditing organizations, we identify and develop questions and problems in the workplace and create a system that can produce results.
We will continue to make further improvements while aiming to decrease our impact on the environment by raising the level of internal auditors.
In manufacturing and sales of adhesive products and related business activities
- 1.Development, improvement and provision of environmentally friendly products
- 2.Environmental Conservation (improvement of environmental impact on surrounding areas)
- 3.Energy Saving (electricity, gas, heavy oil A)
- 4.Effective use of resources and proper disposal of waste (improvement of recycling rate)
- 5.Promotion of Green Procurement
Environmental management system to promote green procurement

Office/Group Company
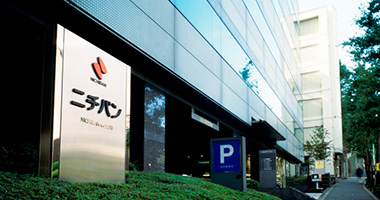
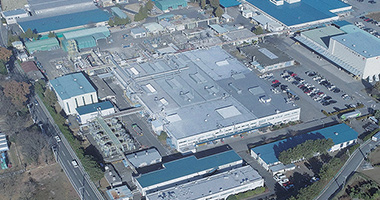
Saitama Factory, Quality & Environment Management Department, Product Design Department
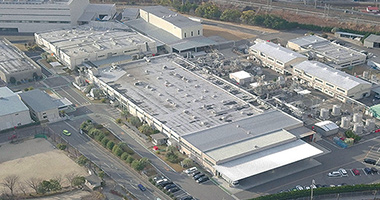
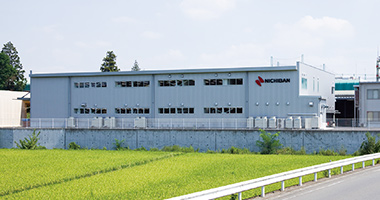
Tape Anjo Factory, Medical Anjo Factory, Advanced and Applied Research Institute
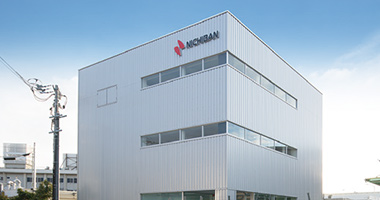
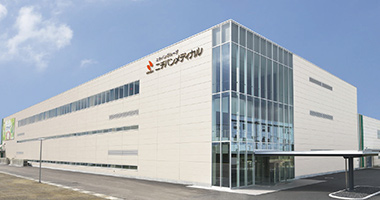
Conduct internal and external audits
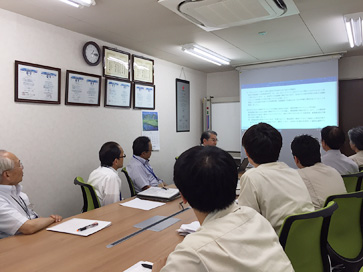
The Nichiban Group conducts internal and external audits to confirm that the environmental management system is functioning effectively and that environmental conservation activities are being implemented effectively. To ensure that the system functions effectively, we confirm that we are working with awareness of our responsibilities, and that we can monitor what we have done. Going forward, we will continue to use the PDCA cycle and work toward a better system.
Environmental load data
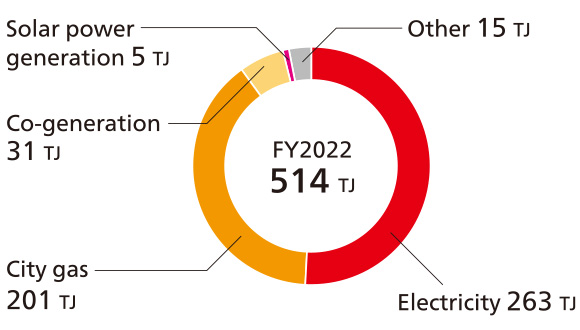
Various environmental impacts from business activities are tabulated for all domestic business sites to determine current conditions, which is useful for activities aimed at reducing energy consumption and the use of solvents.
Scope: all domestic business sites
INPUTS
Environmental accounting
Nichiban has conducted its own environmental accounting since fiscal 1999 to calculate environmental costs and their effects. These efforts target the Headquarters, three domestic factories, and three domestic Group companies, covering a period starting on April 1 through March 31 of the following year. Further, environmental costs are tabulated by dividing them into two categories, capital investments and expenses. Capital investments include the amount of investment related to environmental conservation. Expenses include labor costs related to the research and development of eco-friendly products and environmental conservation activities, as well as the depreciation of equipment used in environmental conservation activities.
Concept of aggregation
- Aggregation range
- Head Quarters, Saitama Factory, Tape Anjo Factory, Medical Anjo Factory, Osaka Factory, 3 Group Companies
- Target period
- From April 1, 2022 to March 31, 2023
- Measurement Standard of Cost of Environment Conservation
-
- Capital investment
- Capital expenditures related to environmental conservation were tabulated within the target period. In the case of spanning the fiscal year, the amount for the current period is counted.
- Cost
- Labor costs are calculated by multiplying the required personnel and hours for each research and development of environmentally friendly products and environmental conservation activities by the average hourly wage. Depreciation expenses are calculated for five years for equipment related to environmental conservation activities based on the fixed asset ledger.
Environmental Conservation Costs
| Classification | Main Activities | FY2021 | FY2022 | |||
|---|---|---|---|---|---|---|
| Capital Investment | Expenses | Capital Investment | Expenses | |||
| 1. Business Area Costs | Environmental conservation costs to reduce environmental impact | 1,817,949 | 536,494 | 1,880,442 | 564,459 | |
| Breakdown | 1.1 Pollution Prevention Costs | Costs for pollution prevention (air pollution, water pollution, etc.) | 665,518 | 172,434 | 658,677 | 145,374 |
| 1.2 Global Environmental Conservation Costs | Costs for global environmental protection (prevention of global warming, energy saving, etc.) | 907,470 | 129,164 | 988,731 | 183,384 | |
| 1.3 Resource Recycling Costs | Costs for effective use of resources and recycling and proper disposal of waste | 244,962 | 234,897 | 233,033 | 235,701 | |
| 2. Upstream/Downstream Costs | Green purchasing and green procurement costs Recycling costs for product containers and packaging |
3,595 | 24,522 | 3,595 | 16,186 | |
| 3. Management Activity Costs | Costs for operating and maintaining the environmental management system Expenses for environmental information disclosure and environmental advertising Costs for monitoring and managing environmental impact |
40,760 | 131,178 | 40,760 | 148,477 | |
| 4. R&D costs | Labor costs for developing environmentally friendly products Costs for developing environmentally friendly products |
169,130 | 12,852 | 169,130 | 12,852 | |
| 5. Social Activity Costs | Environmental activity costs for local communities Donations to environmental organizations |
0 | 12,157 | 0 | 22,486 | |
| 6. Cost for Dealing with Environmental Damage | Insurance premiums for environmental pollution (air pollution, soil pollution, etc.) | 0 | 0 | 0 | 0 | |
| total | 2,031,434 | 717,203 | 2,093,927 | 764,460 | ||
Environmental Conservation Effects
| Environmental Conservation Effects | Environmental Load Index | ||
|---|---|---|---|
| Effect Contents | FY2021 Environmental Impact | FY2022 Environmental impact | Change and Effect of Environmental Load on the Previous Year |
| CO2 emissions in Scope 1 and 2 | 22,620 t-CO2 | 20,710 t-CO2 | 1,910 t-CO2 reduction |
| Waste Generated | 4,227t | 4,041t | 186 t reduction |
| Water Usage | 701,000 m3 | 635,000 m3 | 67,000 m3 reduction |
| Emissions of PRTR substances <total> | 727t | 538t | 189 t reduction |
| Other Effects (Product development to reduce environmental impact, etc.) |
Reduce environmental impacts through purchase of Green Power Certificates | ||
| Equivalent to 2,746 t-CO2 |
Equivalent to 4,995 t-CO2 |
||
Economic Effects of Environmental Conservation Measures
| Effect Contents | FY2021 | FY2022 | |
|---|---|---|---|
| Amount of Money | Amount of Money | ||
| Revenue | Revenue from recycling of waste generated in business activities | 5,010 | 7,279 |
| Total | 5,010 | 7,279 | |
